2. THEORY
2.1 MECHANICS OF CLASSICAL PENDULUM
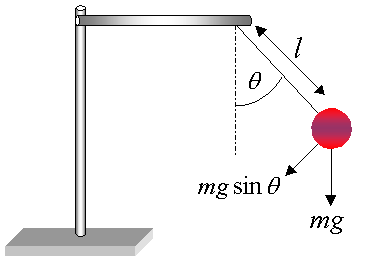
The equation of motion for the pendulum can be derived from Newton's equations for rotational systems in which the angular acceleration is proportional to the total torque. Where m is the mass, g is the acceleration due to gravity and q is the angular displacement from the vertical and is taken to be positive when on the right of the vertical and negative when on the left.

The moment of inertia for the system is given by;


adding the damping (with damping constant proportional to angular velocity) and forcing term and rewriting the equation in dimensionless form2 we obtain;

The terms on the left hand side of [1] represent respectively the acceleration, damping and the gravitational restoring torque. The term on the right hand side represents the driving force of the pendulum.
ω is the natural frequency of the oscillator, q (the quality factor) is proportional to the damping constant, f is the amplitude of the driving torque and ωD is the forcing frequency. For the purposes of this project ω (the natural frequency of the pendulum) will be set to 1, ωD will be set to two thirds of the natural frequency and the system parameter q will be varied and the behaviour observed. It should be noted that the acceleration and velocity terms are both linear where as the restoring torque and driving force are both non-linear. If the approximation sinθ = θ is made then the solution to [1] can be found analytically using mathematical methods such as Laplace transforms. Such methods will show that the plot of the solution to [1] of velocity against displacement will give an ellipse3. This represents a system with little or no damping. Because, for the purposes of this experiment, the non-linearity of the pendulum equation has been retained, mathematical analysis must be abandoned and numerical solutions must be considered.
To gain insight into the behaviour of the pendulum it is useful to observe its trajectory in phase-space. The phase-space diagram of a pendulum is simply a plot of the instantaneous angular velocity versus the angular displacement. To be more correct this is a phase-plane as the pendulum is restricted to moving in one direction and, therefore, only two variables are needed to specify the instantaneous state of the system. In this project each state is plotted as a single white pixel on the screen. The displacement is plotted in the interval (-π, π). Thus, when the trajectory exits through the right edge, it is continued at the left edge.
For a pendulum obeying a linear differential equation the trajectory should appear as a closed curve, such as an ellipse or circle (see fig.2.2.1), which repeats itself over and over. This is called a periodic attractor. This indicates that the pendulum returns to the same point in phase-space at the beginning of each drive cycle and the trajectory is repeated. On the other hand, for a pendulum with light damping, the curve spirals into the centre (0,0). This point is known as the fixed point attractor of the system (see fig.2.2.2).
The Poincaré section is similar to the phase-space in that it plots velocity against displacement except that it does so only once every period of the driving force. If the period of the driving force is τ = 2π/ωD , then a single point is plotted every time the time t = n τ, (n = 1,2,3.....). Thus if the pendulum is periodic then the Poincaré section will consist of a discrete number of points. In this project use is made of the fact that the step size in the program is a fraction of the driving frequency. So, when the ratio of the total number of steps per driving period to the ith iteration is an integer, a point is plotted.
Another way of viewing the dynamics of the system is with bifurcation diagrams. These diagrams are most useful for showing chaotic behaviour. This gives a more global picture of the dynamics and allows the simultaneous observation of periodic and chaotic behaviour.
For certain values of the parameters, the system will have only one long-term trajectory, while for others two or more motions may be possible. Mathematically, bifurcations occur when one solution to an equation gives way to two or more solutions. One way to show bifurcations with the pendulum is by plotting the angular velocity against the driving amplitude. For periodic motion the angular velocity, v, has one value at a given time during the drive cycle. As the forcing frequency is increased sufficiently, more than one value is observed.
The Runge-Kutta algorithm is based on the Euler-Cauchy method for solving first order differential equations4. It is a step by step process where function values for a range of values of x is accumulated.
To solve y' = f (x, y) given the initial conditions y = y0 at x = x0 for a range of values x = x0(h)xn where h is the step size;

Finding y1 requires four intermediate calculations.


This algorithm is reasonably accurate and is easy to program. The accuracy is determined by the step size h. The smaller h is, the more accurate the end result will be thus, there is a temptation to choose h to be as small as possible. However, if h is too small, the equation will take too long to evaluate over a large number of iterations.
The equation used for this project is a second order differential equation so in order to apply the Runge-Kutta algorithm it must first be reduced to two first order equations. This is done by making the substitution

into equation [1]. Now we have two first order equations:

and

To solve this: choose the initial values for x, v, t, etc. Then


etc. k31, k32, k41, and k42 are calculated in the same way. Here X represents the next value of x to be evaluated and likewise with V. Then finally;
t=T

